GNU MCSim Tutorial 2
Monte Carlo simulation and sensitivity analysis
Nan-Hung Hsieh
May 16, 2019
Outline
1. Uncertainty
MonteCarlo()SetPoints()
2. Sensitivity Analysis
- Morris Elementary Effects Screening
- Fourier Amplitude Sensitivity Testing
3. Demo & Exercise
- R package: sensitivity, pksensi
- One-compartment TK model, Tetrachloroethylene PBPK, Ethylbenzene PBPK
Uncertainty in Risk Analysis
The objective of a probabilistic risk analysis is the quantification of risk from made man-made and natural activities (Vesely and Rasmuson, 1984).
Two major types of uncertainty need to be differentiated:
(1) Uncertainty due to physical variability
(2) Uncertainty due to lack of knowledge in
Modeling uncertainty
Parameter uncertainty
Completeness uncertainty
Uncertainty in modeling
Deterministic Simulation
- Define exposure unit & calculate point estimate
1-D Monte Carlo Simulation: Uncertainty
- Identify probability distributions to simulate probabilistic outputs
2-D Monte Carlo Simulation: Uncertainty & Variability
- Bayesian statistics to characterize population uncertainty and variability
Uncertainty in parameter
The parameter is an element of a system that determine the model output.
Parameter uncertainty comes from the model parameters that are inputs to the mathematical model but whose exact values are unknown and cannot be controlled in physical experiments.
y=f(xi)
With four parameters I can fit an elephant, and with five I can make him wiggle his trunk.
-John von Neumann
Mayer J, Khairy K, Howard J. Drawing an elephant with four complex parameters. Am. J. Phys. 78, 648 (2010) https://doi.org/10.1119/1.3254017
Uncertainty in PBPK model parameter
Physiological parameters
Cardiac output
Blood flow rate
Tissue volume
Absorption
Absorption fraction, absorption rate, ...
Distribution
Partition coefficient, distribution fraction, ...
Metabolism
Michaelis–Menten kinetics, ...
Elimination
First order elimination rate, ...
Simulation in GNU MCSim
Monte Carlo simulations
- Perform repeated (stochastic) simulations across a randomly sampled region of the model parameter space.
Used to: Check possible simulation (under given parameter distributions) results before model calibration
SetPoints simulation
- Solves the model for a series of specified parameter sets. You can create these parameter sets yourself or use the output of a previous Monte Carlo or MCMC simulation.
Used to: Posterior analysis, Local/global sensitivity analysis
MonteCarlo()
The MonteCarlo specification gives general information required for the runs: (1) the output file name, (2) the number of runs to perform, and (3) a starting seed for the random number generator. Its syntax is:
MonteCarlo("<OutputFilename>", <nRuns>, <RandomSeed>);"<OutputFilename>"The character string, enclosed in double quotes, should be a valid filename for your operating system. <nRuns>The number of runsshould be an integer, and is only limited by either your storage space for the output file or the largest (long) integer available on your machine. <RandomSeed>The seedof the pseudo-random number generator can be any positive integer (including zero).
Here is an example of use:
MonteCarlo("simmc.out", 50000, 9386);Distrib()
The specification of distributions for simple Monte Carlo simulations,
Distrib(<parameter identifier>, <distribution-name>, [<shape parameters>]);Here are some examples:
LogUniform, with two shape parameters: the minimum and the maximum of the sampling range in natural space.
Uniform, with two shape parameters: the minimum and the maximum of the sampling range.
Normal_cv, is the normal distribution with the coefficient of variation instead of the standard deviation as second parameter.
Normal_v, is also the normal distribution with the variance instead of the standard deviation as second parameter.
LogNormal takes two reals numbers as parameters: the geometric mean and the geometric standard deviation.
TruncNormal (truncated normal distribution), takes four real parameters: the mean, the standard deviation, the minimum and the maximum.
Example
## ./mcsim.one.model.R.exe one.mtc.in.R ###### Monte Carlo simulation input file for one compartment modelMonteCarlo ("simmc.out", 10, 95814);Distrib (Ka, Uniform, 0.2, 0.8);Distrib (Ke, Uniform, 0.03, 0.1);Simulation { # 1 OralDose = 100; BW = 60; PrintStep (C_central, 0, 8, 1);}End.SetPoints()
This command specifies an output filename, the name of a text file containing (1) the chosen parameter values, (2) the number of simulations to perform and (3) a list of model parameters to read in. It has the following syntax:
SetPoints("<OutputFilename>", "<SetPointsFilename>", <nRuns>, <parameter identifier>, <parameter identifier>, ...);"<OutputFilename>"The character string, enclosed in double quotes. "<SetPointsFilename>"The character string, enclosed in double quotes. <nRuns>should be less or equal to the number of lines (minus one) in the set points file. If a zero is given, all lines of the file are read.<parameter identifier>a comma-separated list of the parameters or vectors to be read in the SetPointsFilename.
Example
## ./mcsim.one.model.R.exe one.setpt.in.R ###### Setpoint simulation input file for one compartment model## Use "sim.out" that generated from "one.mtc.in.R"SetPoints ("setpts.out", "simmc.out", 0, Ka, Ke);Simulation { # 1 OralDose = 100; BW = 60; PrintStep (C_central, 0, 8, 1);}End.Uncertainty & sensitivity analysis
Sensitivity Analysis
Sensitivity Analysis
"The study of how uncertainty in the output of a model (numerical or otherwise) can be apportioned to different sources of uncertainty in the model input."
Why we need SA?
Parameter Prioritization
Identify the most important factors
Adjust the uncertainty in the model response in experiment design
Parameter Fixing
Identify the least important factors
Simplify the model if it has too many factors
Parameter Mapping
- Identify critical regions of the inputs that are responsible for extreme values of the model response
It consequently provides useful insight into which model input contributes most to the variability of the model output
Classification of SA Methods
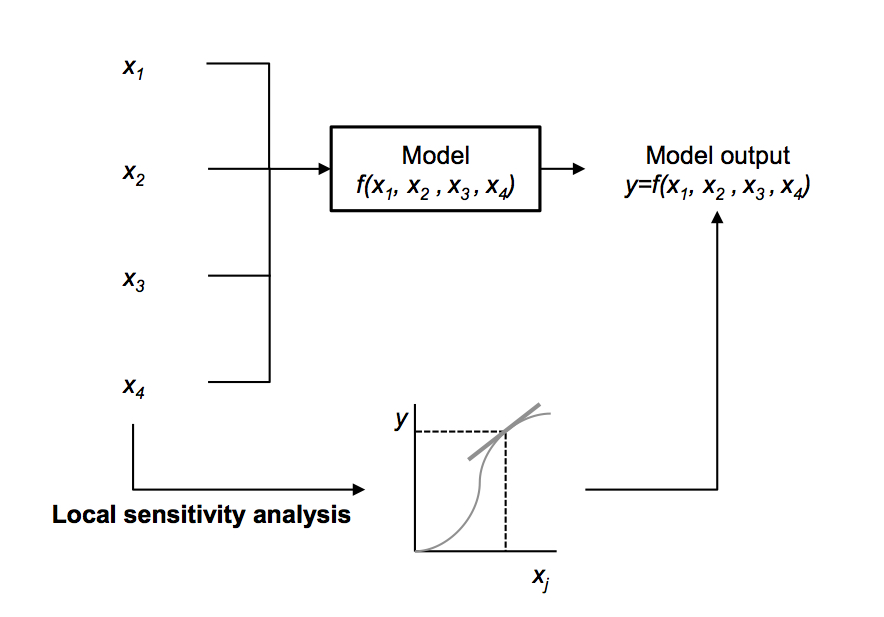
Local (One-at-a-time)

"Local" SA focus on sensitivity at a particular set of input parameters, usually using gradients or partial derivatives
Usually, some people have experience in modeling they have the knowledge in local sensitivity analysis.
This method is very simple. You move one parameter and fix other parameters then check the change of model outputs.
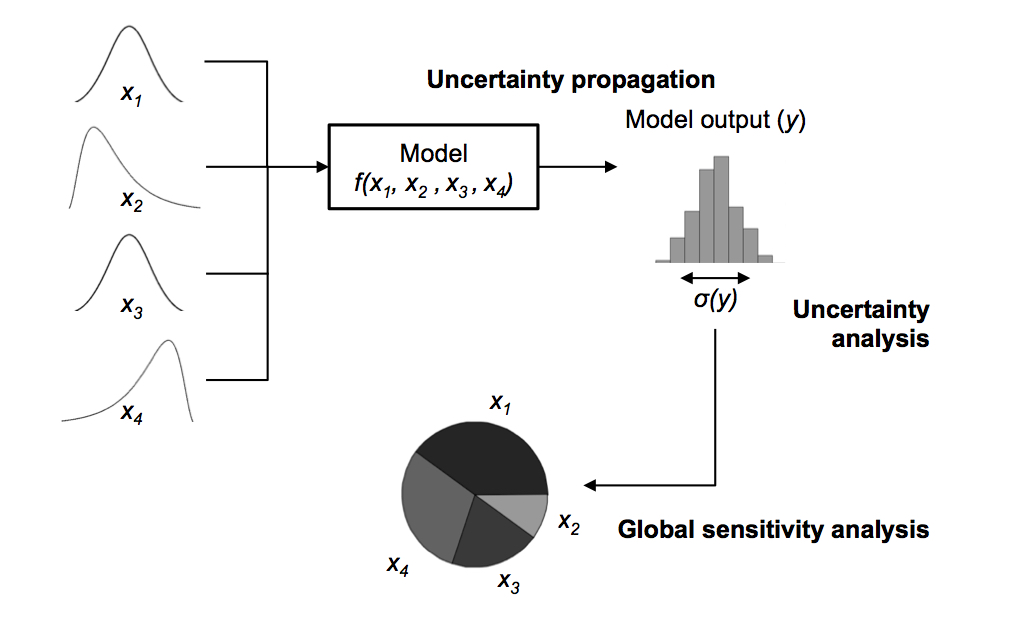
On the other side, some researcher also developed the approach that moves all parameters at a time and checks the change of model output. We call it Global sensitivity analysis or variance-based sensitivity analysis.
Classification of SA Methods
Local (One-at-a-time)

"Local" SA focus on sensitivity at a particular set of input parameters, usually using gradients or partial derivatives
Global (All-at-a-time)

"Global" SA calculates the contribution from the variety of all model parameters, including Single parameter effects and Multiple parameter interactions
Usually, some people have experience in modeling they have the knowledge in local sensitivity analysis.
This method is very simple. You move one parameter and fix other parameters then check the change of model outputs.
On the other side, some researcher also developed the approach that moves all parameters at a time and checks the change of model output. We call it Global sensitivity analysis or variance-based sensitivity analysis.
Sensitivity indeices
First order (Si)
- The output variance contributed by the specific parameter xi,
also known as main effect
Interaction (Sij)
- The output variance contributed by any non-identical pair of input parameters
Total order (ST)
- The output variance contributed by the specific parameter and interaction,
also known as total effect
“Local” SA usually only addresses first order effects
“Global” SA can address total effect that include main effect and interaction
Morris Elementary Effects Screening
A simple but effective way of screening a few important input factors (Morris 1991).
Perform parameter sampling in Latin Hypercube following "One-Step-At-A-Time"
Can compute the importance (μ∗) and interaction (σ) of the effects
⎡⎢ ⎢ ⎢ ⎢ ⎢ ⎢ ⎢ ⎢ ⎢ ⎢ ⎢ ⎢⎣10000…011000…011100…011110…011111…0⋮⋮⋮⋮⋮⋱⋮11111…1⎤⎥ ⎥ ⎥ ⎥ ⎥ ⎥ ⎥ ⎥ ⎥ ⎥ ⎥ ⎥⎦⎛⎜ ⎜ ⎜ ⎜⎝b0b1⋮bk⎞⎟ ⎟ ⎟ ⎟⎠=⎛⎜ ⎜ ⎜ ⎜⎝y1y2⋮yk+1⎞⎟ ⎟ ⎟ ⎟⎠
Variance-Based Method
Variance-based method for sensitivity analysis were first employed by chemists (Cukier et al. 1973). The method, known as FAST (Fourier Amplitude Sensitivity Test).
Robust in factor fixing, but had relatively high computational cost than local SA.
Main effect
Si=V[E(Y|Xi)]V(Y)
Total effect
Example of parameter 1 for model with three parameters
ST1=S1+S12+S13+S123
S1+S2+S3+S12+S13+S23+S123=1
Steps to performing sensitivity analysis
Identify all model factor (xi) which should be consider in analysis
Characterise the uncertainty for each selected input factor
Generate a sample of a given size from the previously defined probability distribution
Define the variable of interest (yi,t)
Execute the model for each combination of factor
Visualize and interpret the outputs
Estimate the sensitivity measures ("check convergence")
Decision making
R package sensitivity
A collection of functions for factor screening, global sensitivity analysis and reliability sensitivity analysis. Most of the functions have to be applied on model with scalar output, but several functions support multi-dimensional outputs.
ls(pos = "package:sensitivity")## [1] "ask" "atantemp.fun" "campbell1D.fun" ## [4] "delsa" "dgumbel.trunc" "dnorm.trunc" ## [7] "fast99" "ishigami.fun" "linkletter.fun" ## [10] "morris" "morris.fun" "morrisMultOut" ## [13] "parameterSets" "pcc" "pgumbel.trunc" ## [16] "PLI" "PLIquantile" "plot3d.morris" ## [19] "plotFG" "pnorm.trunc" "PoincareConstant"## [22] "PoincareOptimal" "qgumbel.trunc" "qnorm.trunc" ## [25] "rgumbel.trunc" "rnorm.trunc" "sb" ## [28] "scatterplot" "sensiFdiv" "sensiHSIC" ## [31] "shapleyPermEx" "shapleyPermRand" "sobol" ## [34] "sobol.fun" "sobol2002" "sobol2007" ## [37] "sobolEff" "sobolGP" "soboljansen" ## [40] "sobolmara" "sobolmartinez" "sobolMultOut" ## [43] "sobolowen" "sobolroalhs" "sobolroauc" ## [46] "sobolSalt" "sobolSmthSpl" "sobolTIIlo" ## [49] "sobolTIIpf" "soboltouati" "src" ## [52] "support" "tell" "template.replace"Example: Morris
f(x)=sin(x1)+asin2(x2)+bx43sin(x1)
set.seed(1111)x <- morris(model = ishigami.fun, factors = c("Factor A", "Factor B","Factor C"), r = 30, binf = -pi, bsup = pi, design = list(type = "oat", levels = 6, grid.jump = 3))par(mfrow = c(1,3))plot(x$X[,1], x$y); plot(x$X[,2], x$y); plot(x$X[,3], x$y)par(mar=c(4,4,1,1))plot(x, xlim = c(0,10), ylim = c(0,10))abline(0,1) # non-linear and/or non-monotonicabline(0,0.5, lty = 2) # monotonicabline(0,0.1, lty = 3) # almost linearlegend("topleft", legend = c("non-linear and/or non-monotonic", "monotonic", "linear"), lty = c(1:3))Example: FAST
x <- fast99(model = ishigami.fun, factors = 3, n = 400, q = "qunif", q.arg = list(min = -pi, max = pi))par(mfrow = c(1,3))plot(x$X[,1], x$y); plot(x$X[,2], x$y); plot(x$X[,3], x$y)plot(x)pksensi

Final thoughts
If model evaluation is computationally burdensome, use the Morris method as an initial screen to remove clearly “non-influential” parameters (Hsieh et al., 2018)
Use the lower error tolerance value to solve the problem in computational error.
Always plot the data. Make sure you do not make any mistake in parameter sampling.
Be aware of the parameter uncertainty. If the sampling range is too broad, try using the log-transformed distribution.
Try Quasi-Monte Carlo (QMC). The QMC method can generate more "uniform" distribution than random MC sampling.
Making sure to check convergence (Sarrazin et al., 2016)
Demo & Exercise
Exercise 1
Create the MCSim's input file and run Monte Carlo simulation to conduct uncertainty analysis of ethylbenzene concentration in blood (0 - 6 hr), the exposure condition is 100 ppm exposure for 4 hours.
Exercise 2
At the same exposure condition, conduct Morris elementary effects screening to find the influential parameters for blood concentration during the 2-hr post exposure. The suggested time points are 4, 4.5, 5, 5.5, and 6 hr.
Exercise 3
Use pksensi and conduct FAST method to find the non-influential parameter for blood concentrations.
Exercise 4
Compare the sensitivity measures (first order, interaction, total order) for Morris (exercise 2) and FAST (exercise 4).
Exercise 5
Reproduce the published result of acetaminophen-PBPK model by following the vignette in pksensi.
Demo examples
1-compartment model (Based on httk package)
- Uncertainty analysis of Css
- Uncertainty analysis of reverse toxicokinetic modeling
- Sensitivity analysis
Mutivariate toxicokinetic modeling
- Uncertainty analysis
- Sensitivity analysis
Supplementary examples
- Tetrachloroethylene (PERC) PBPK model
- Ethylbenzene (EB) PBPK model
- Acetaminophen (APAP) PBPK model
